View Customer Timeline Activity Graph
Applies to: Administrators, Customer Support, Compliance Officers
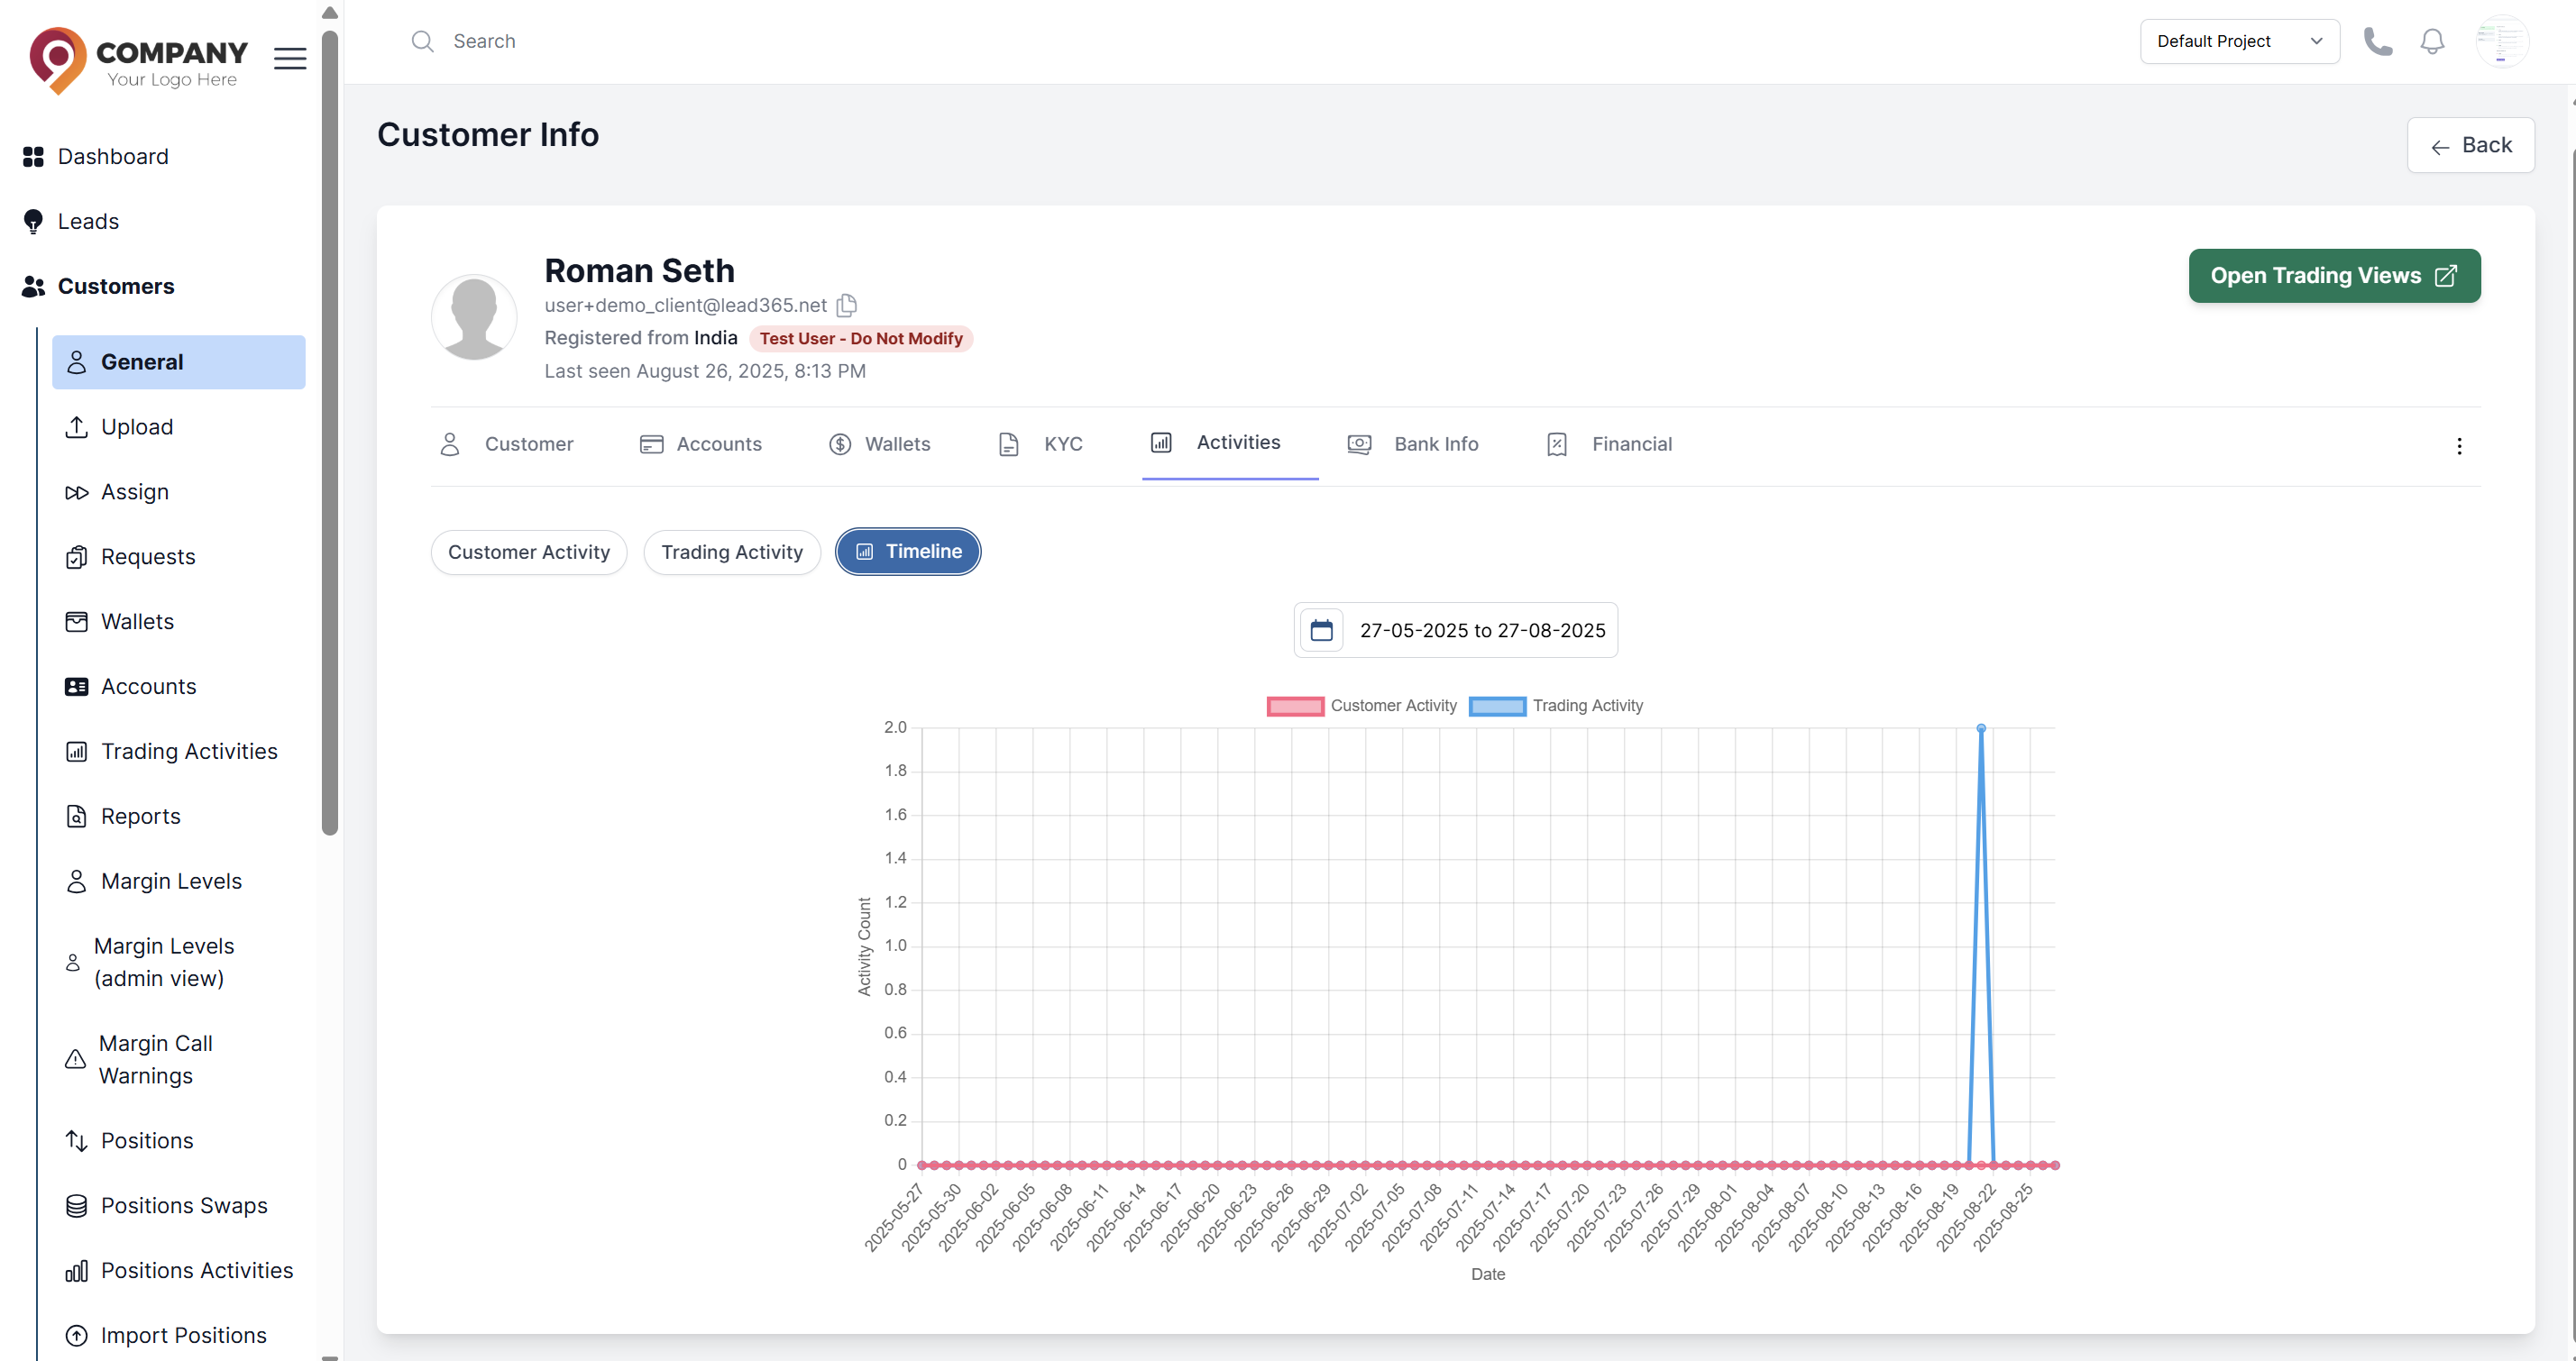
Beyond the list view, the Timeline Activity Graph provides a visual, chronological representation of all customer actions for easier pattern recognition and audit trails.
Accessing the Timeline
- Navigate to the main Customers list.
- Click on a specific customer to open their detailed profile.
- Look for a tab called Activities This is where the graph is displayed.
Understanding the Graph
The timeline typically uses a vertical layout to display events. Two different lines show the number of customer activities and trading activities respectively.
Using the Timeline for Support
This view is invaluable for:
- Troubleshooting: Correlate customer actions with trading activities to identify what triggered reported issues.
- Compliance: Audit the chronological sequence of both customer and trading events for regulatory requirements.
- Security: Detect suspicious patterns across customer and trading activity lines, such as unusual behavior correlations.
- Capacity Planning: Forecast resource needs by understanding peak activity periods across both customer and trading functions.
- Business Intelligence: Analyze correlations between customer engagement levels and trading volumes to inform product development.